A while back, I took advantage of our company's professional certification support program to earn the Google Data Analytics Professional Certificate.
I'll walk you through what you can learn, the difficulty level, and share my impressions from taking the course!
What is the Google Data Analytics Professional Certificate?
It's an online learning program offered by Google that covers data analysis fundamentals through advanced topics across eight courses.
- Data analysis process and methodology
- How to organize and structure data
- Using spreadsheets effectively
- Data organization with SQL
- Creating visualizations with Tableau
- Using R Markdown
And much more — it covered a remarkably broad range of skills.
While "10 hours per week for roughly 6 months" is cited as the guideline, I completed it in about 4 months at a slower pace. If you focus, you can definitely finish in an even shorter timeframe.
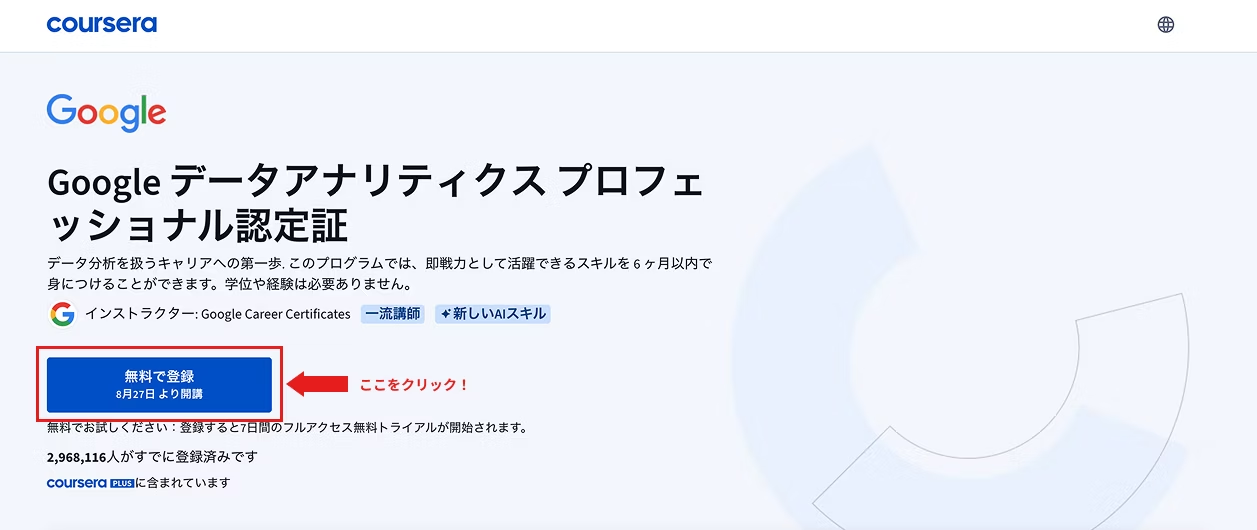
The course is taken through the Coursera platform on a monthly subscription model. There are occasional free enrollment campaigns, so it's worth targeting those periods too.
There's a 1-week trial period, so you can use that time to decide whether you can really keep up with the course. Just be careful — after the trial ends, automatic renewal kicks in!
You can register and start immediately from Coursera's "Google Data Analytics Professional Certificate" page.
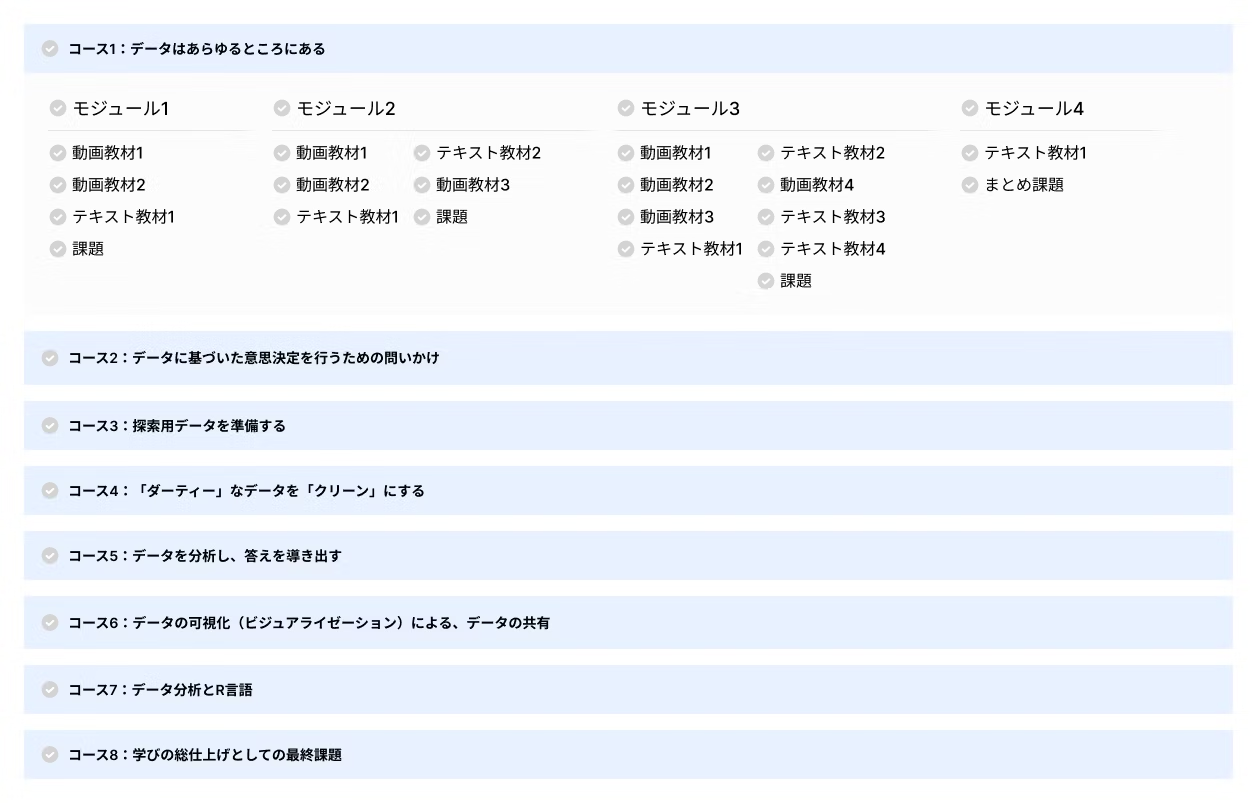
The learning structure
The structure is organized so that each course contains multiple modules. You complete all learning materials (videos, documents, etc.) and take tests for each module. Once you clear the assignments for all courses, you receive a completion certificate.
The documentation also includes links to related tools and external learning materials, which is helpful for deepening understanding. However, if you try to carefully review everything, you'll never have enough time. So I took notes on terminology and links as I went, then researched them in more detail later.
With this approach, you can pass the test without any problems!
There's so much material overall, but I was grateful for the thoughtful design that lets you change the status to "Complete" whenever you want.
About course difficulty
When you hear "SQL" or "R," you might feel a bit intimidated, but since the instruction explains everything from setup to the fine details, it wasn't as difficult as I initially thought.
If you read the materials thoroughly, you can pass the tests, and even if you fall short of the passing score, you can retake them—it's an incredibly thoughtful system.
The comprehensive final exam has a limit on how many times you can take it in a day, but the limit resets after 24 hours, so you effectively have unlimited attempts!
Tools like BigQuery, Tableau, and RStudio—which you wouldn't normally touch—also appear in the course, but they're explained in detail from installation to usage, so there's nothing to worry about.
Plus, the tools used in the course are designed to stay within the free tier, so apart from Coursera's monthly subscription, you won't incur any additional costs—very wallet-friendly.
The translation feature was challenging in a different sense.
The materials are primarily in English. Of course, the video, documentation, and tests all have translation features, and the accuracy is quite high, but occasionally similar words get translated to the same Japanese word.
In multiple-choice questions, it's not uncommon to see two seemingly identical options side by side, which presents its own unique challenge.
Overview of each course you'll take
I know that was a long introduction, but now I'd like to walk you through the learning content of each course.
【Course 1: Data is everywhere】 As the first course, this is primarily a lecture-based course covering the fundamentals of data analysis. You'll learn how data analysts approach analysis and the entire process they follow. The content you learn here will form the foundation for Course 2 and beyond.
【Course 2: Asking the right questions to make data-driven decisions】 This course focuses on "questioning" techniques for deeply exploring problems that need to be solved. You'll learn about interview and communication methods, as well as how to share analysis results.
Now we finally begin hands-on learning! You'll master the basics of spreadsheet functions and types of errors—knowledge that's frequently used in real-world work.
This course progresses at a relatively smooth pace.
【Course 3: Preparing exploratory data】 This is the phase where you prepare analysis data. You'll learn about data structure and collection methods, and understand the "clean data" concept that's critical to Course 4. In addition to spreadsheets, you'll also work with SQL in BigQuery for data manipulation. This is the first major difficulty point.
If you don't get the fundamentals down, you'll stumble later, so I recommend moving forward slowly but with understanding.
【Course 4: Turning "dirty" data into "clean" data】
Learn essential data cleaning methods to improve analysis accuracy.
Understand why cleaning is necessary and what happens when you analyze dirty data, then experience data cleaning using spreadsheets and BigQuery.
With many functions and queries involved, this course is quite challenging.
[Course 5: Analyze Data and Draw Conclusions]
Through the data preparation and cleaning steps learned so far, you'll practice processing data. Filtering by specific conditions, calculating averages, and uncovering hidden facts and trends in your data through various calculations—this is the core phase of the program.
[Course 6: Data Visualization and Sharing]
Learn how to visualize data using Tableau and share it effectively. Even following the video instructions exactly, I often encountered errors and issues, so I struggled quite a bit personally.
It's supposed to be intuitive and require no specialized knowledge, but honestly, I'm still not confident I can use it well.
[Course 7: Data Analysis with R]
Data analysis using R finally makes an appearance here. Starting with R installation, you shouldn't run into problems if you follow the materials. However, once you reach the analysis and visualization phases, be prepared for unfamiliar terminology and concepts to appear frequently.
The range of visualizations you can create extends well beyond Tableau, and it becomes incredibly enjoyable the moment you unlock those capabilities. The appeal was also in being able to complete report creation entirely in R.
This was personally my favorite course.
Course 8: Final Project as a Culmination of Learning
The grand finale! You'll apply everything you've learned and take on a data analysis challenge on your own. Through several case studies, you'll develop your own unique output.
The latter half of the course focuses mainly on employment as a data analyst. You can learn by watching interview scenario scenes, but since the atmosphere differs from Japanese interviews, it's best to view it more as a reference. Honestly, I mostly skimmed through it.
Summary
I've covered a lot of ground—how does it sound?
I've packed in points I personally wished I'd known before taking the course, without spoiling the main content.
Based on my honest experience taking the course, I believe it's an accessible credential for those aiming to transition into the web industry from no prior experience. While you may have few opportunities to use it in daily work at a production company, when the time comes, being able to do data analysis is absolutely better than not being able to do it.
Even tools you don't normally use are explained carefully—from implementation to basic usage—so people new to the web industry can learn with confidence. That said, those seeking to dive deeper into more advanced applications might find it slightly lacking. While the "Google Data Analytics Professional Certificate" isn't widely known, the strong merit is being able to publicly demonstrate that you possess Google-recognized data analytics skills.
If you're interested, you might consider starting with a free trial.


A self-made director since joining as a new graduate, currently thriving in my role! I'm pursuing the goal of becoming a multi-talented professional who can master every field, from design to ad operations. At work, I aim for smart direction, while in my private life I enjoy a reclusive fortress of a home. I happen to like anime.
Handa
Web Director / Joined 2022