
This is looking back a bit. In a previous article, I shared some experiences about attending data analytics events and obtaining certifications. This time, I'd like to write about creating dashboards in Looker Studio.
At first, I approached it with some hesitation. But once I started turning numbers into graphs, I found myself naturally asking "Why is this trend appearing?" New questions and interests emerged, and as I experimented with "What data do I need to dig deeper?", I realized there was a joy to getting absorbed in the process before I knew it.
That said, it's true that it initially feels heavy. So this time, I'd like to share insights about the lightweight dashboard approach we practice at our company, hoping it becomes a hint for those who feel "data analytics has a high barrier to entry."
Through this article, I'd be delighted if even one more person realized "I don't need to be so uptight about this" and "Maybe we should give it a try too", and could engage with data more casually.
What is "Looker Studio" anyway?
Many of you may already know, but Looker Studio is a BI tool provided by Google.
You can consolidate data scattered across various management screens—such as Google Analytics, Google Ads, and Google Search Console—into a single dashboard.
While you can build reports through drag-and-drop operations, it also offers customization options, so it's used by everyone from beginners to experts.
It's free to use, so if you're interested after reading this article, please give it a try.
https://lookerstudio.google.com/overview
The ideal is a place where "you can understand everything by looking here."
We track site traffic trends across weekly, monthly, and yearly spans, while also providing specialized detailed reports tailored to different areas—such as event reports, search reports, and traffic reports.
In this way, we aim for a state where you can seamlessly move from grasping the full picture to conducting deep analysis, all within Looker Studio.
That said, while it sounds good when put into words, the reality is quite a bit of "trial and error."
Behind the dashboard creation
We started by taking the safe route—organizing weekly and monthly reports.
Essentially, we create dashboards by linking data tables from GA4 and similar sources.
- Weekly report
Used to understand week-over-week growth rates and recent changes—questions like "How is the newly published article performing?" or "What are this week's trending keywords?"
- Monthly and yearly reports
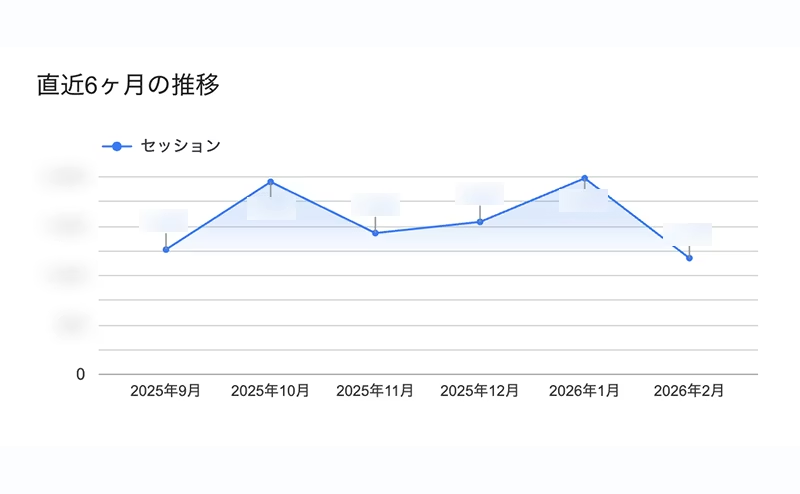
Review your site's overall growth using trend graphs from the past 6 months and year-over-year comparisons. Monitor device ratios and changes in new vs. returning visitor proportions over medium to long-term periods as a regular checkpoint to assess your site's health.
All reports leverage Looker Studio's rich visualization capabilities to provide intuitive understanding of your situation at a glance.
Here's a brief summary of how we use it.
① Using scorecards and graphs
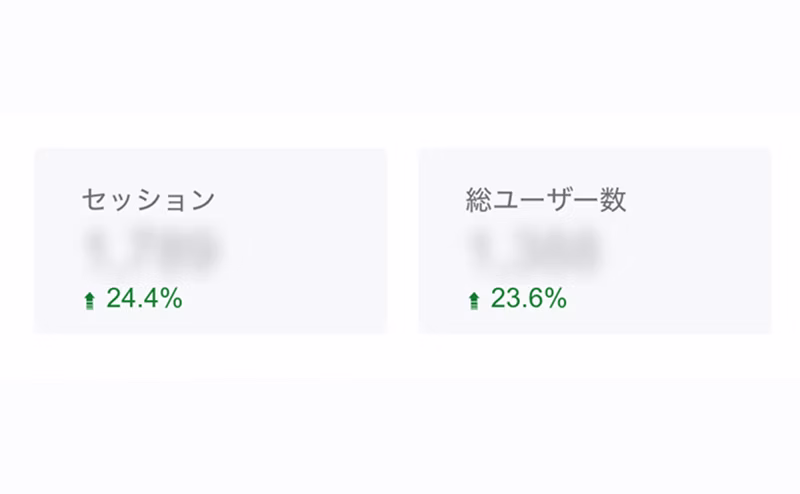
Key metrics are displayed prominently in scorecards with comparison values arranged side-by-side, making anomalies immediately apparent.
Access trends are presented as line charts or period graphs, allowing you to visually track traffic patterns.
② Multi-faceted visualization
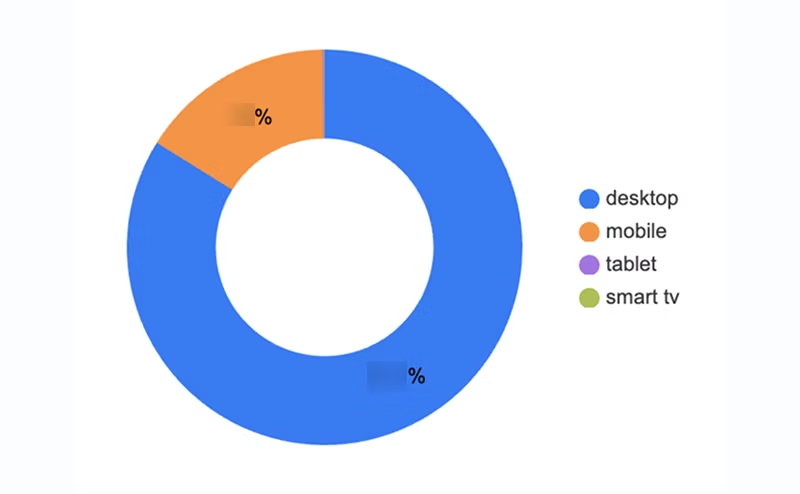
Device ratios visualized through pie charts and new vs. returning visitor breakdowns. Changes in proportions that are difficult to grasp from raw numbers become immediately clear.
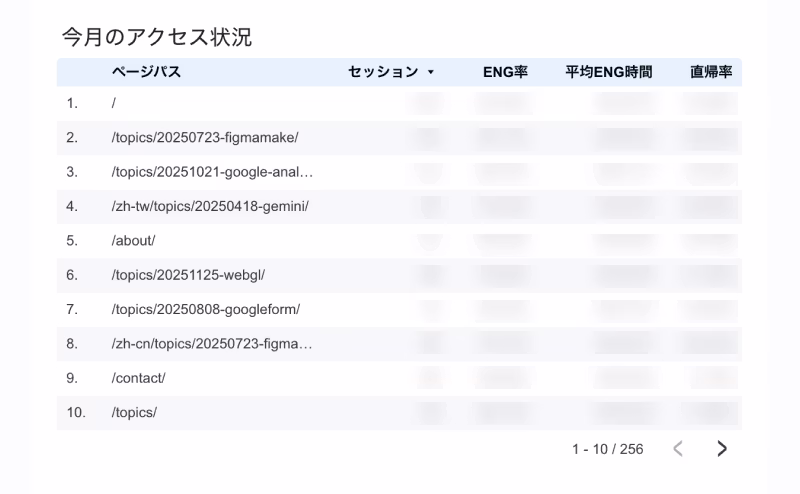
③ Detailed data table
We also create custom lists extracting only the metrics we want to see, such as engagement time by page path.
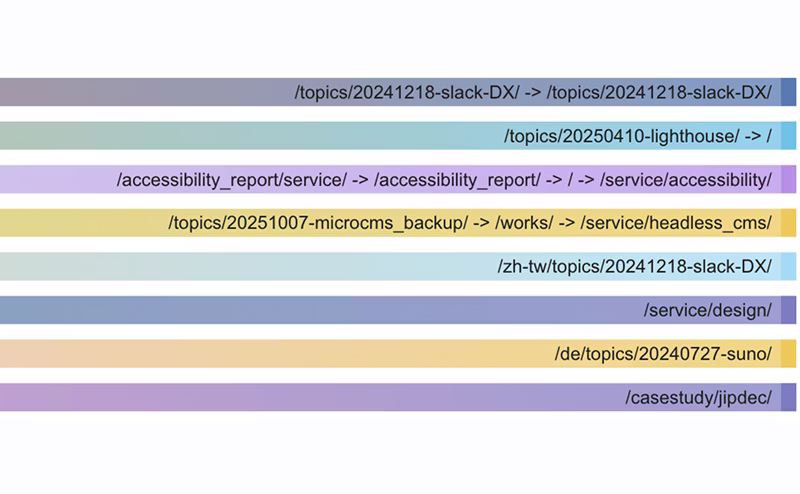
Once the foundational reports were in place, we decided to challenge ourselves with deeper analysis by integrating with BigQuery.
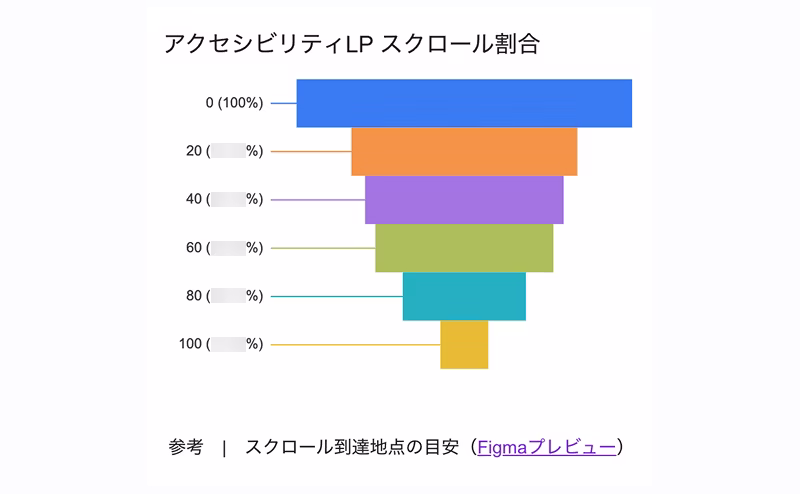
For example, "visualizing user navigation paths within the site" — something difficult to express with standard features.
By organizing the data accumulated in BigQuery and feeding it into Looker Studio's sankey chart, we can now intuitively understand user behavior across the site.
We are currently in the process of automating these queries and setting up pipelines to ensure the latest data is always reflected.
As for visualization, it's not quite as polished as the GA4 interface yet, so we're still making adjustments in that area.
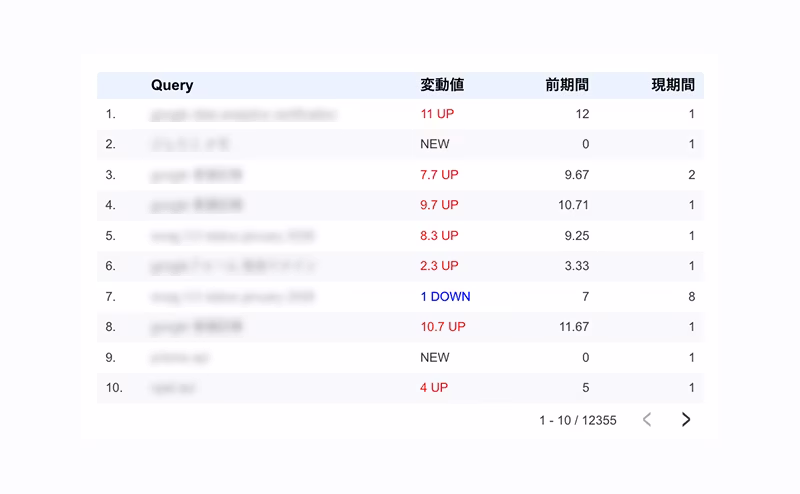
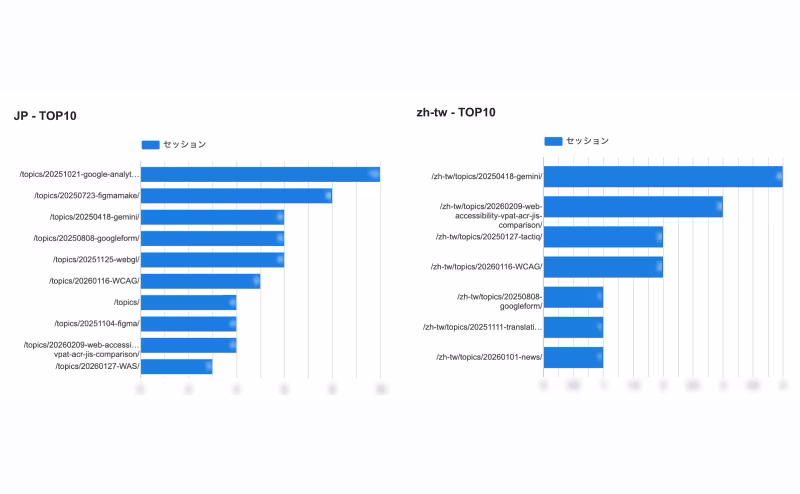
We also use "data integration" to link different data tables—tracking average search ranking fluctuations by keyword, creating a top 10 popular topics list by country, and so on.
To be honest, we're struggling to organize the dashboard cleanly because we've been packing in various things out of curiosity—"this could be interesting to know"—rather than being systematic.
That said, this dashboard is being used in our weekly team meetings.
For our company, which focuses heavily on content creation, the "top 10 popular articles" item is of particular interest.
It's genuinely rewarding to see that articles you've written are being read through the numbers, and it's also fascinating to spot variations in topics that resonate differently by region—"not so much domestically, but getting a lot of reads overseas," for example.
Summary
Both are still being actively refined in terms of accuracy, but right now we prioritize "exploring new insights by interacting with the data rather than pursuing 100% perfect answers."
Instead of staring intently at numbers, we open the dashboard with a light touch—"I wonder how this week turned out?"
Even a casual approach like that counts as proper 'data utilization.'
*The various data we utilize are handled appropriately as statistical information using anonymized IDs that cannot identify individuals, in accordance with our Privacy Policy.


A self-made director since joining as a new graduate, currently thriving in my role! I'm pursuing the goal of becoming a multi-talented professional who can master every field, from design to ad operations. At work, I aim for smart direction, while in my private life I enjoy a reclusive fortress of a home. I happen to like anime.
Handa
Web Director / Joined 2022